Synteyny Block Analysis
Usually, users would use just BLAST results to infer the homologue genes between soybean genomes. However, soybean is a paleopolyploidy plant and encountered twice whole genome duplication events 1 majority of the genes will have paralogue counterparts, and they may confound the search result. The synteny block inference could associate the target gene with their neighbour genes during the same region, and provide a survey about the homology on the chromosome level, which could help the user overcome this problem.
We performed JCVI/MCscan pipeline to generate pair-wise synteny blocks and developed an in-house javascript module to visualize the result on our website. The result was illustrated on both the genome level (synteny tab) and gene level (synteny information box on gene search tab), with interactive interface with capability of detail information popup and zoom in and out.
Synteny function was located on Synteny tab under Tools category.
Macro-synteny View
User could first choose query genome and subject genome, as well as the chromosomes on those two, followed by clicking view button to generate macro-synteny view.

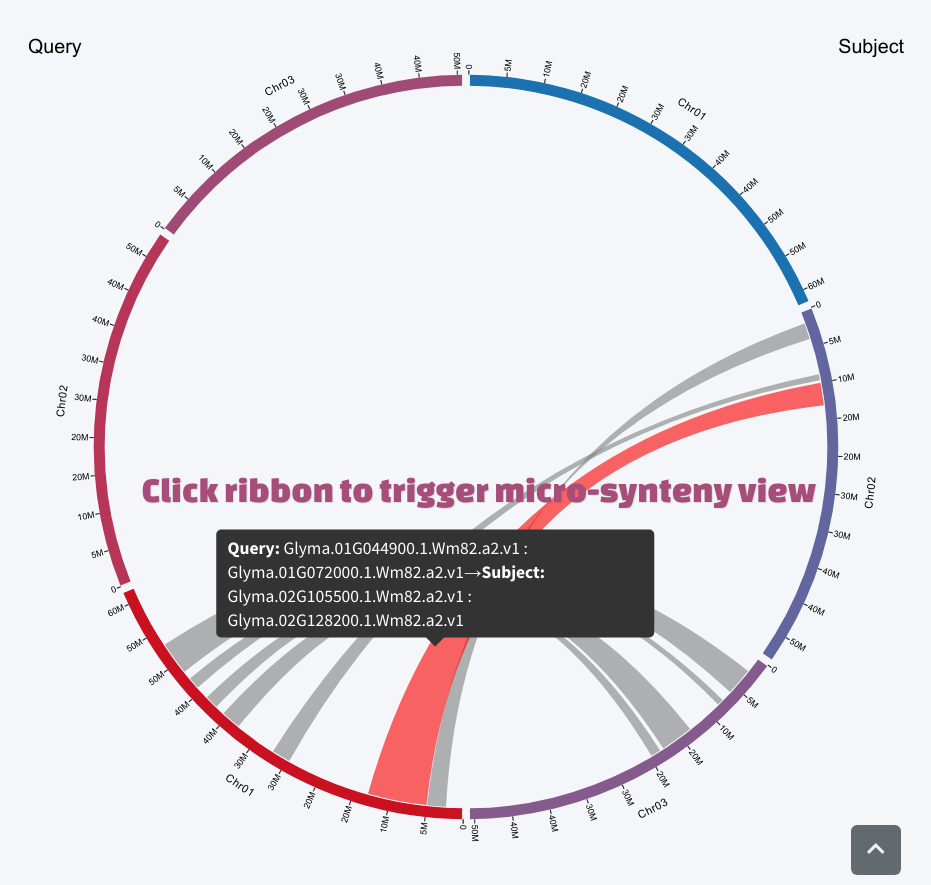
The svg plot was auto-adjusted by browser window size. User could resize the window to get a complete view of the circos-like macro synteny plot. Putting the mouse over the ribbon of interest will highlight the ribbon and trigger a tooltip to show boundary gene information of the synteny block.
Micro-synteny View
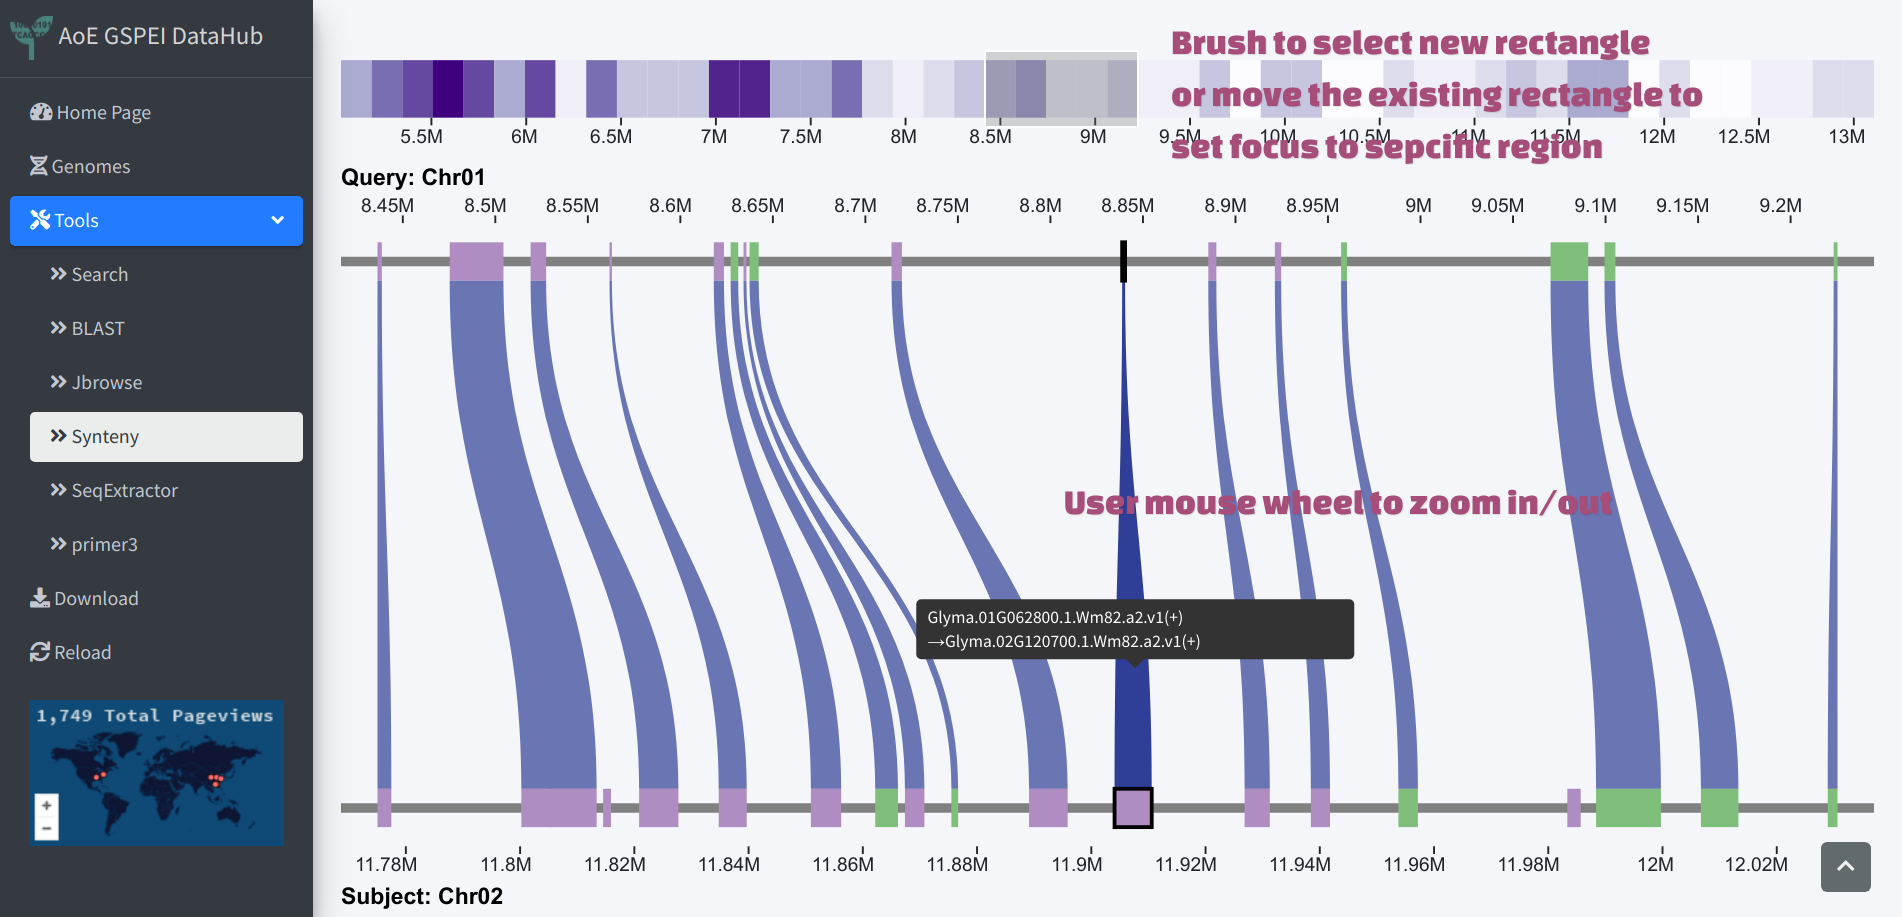
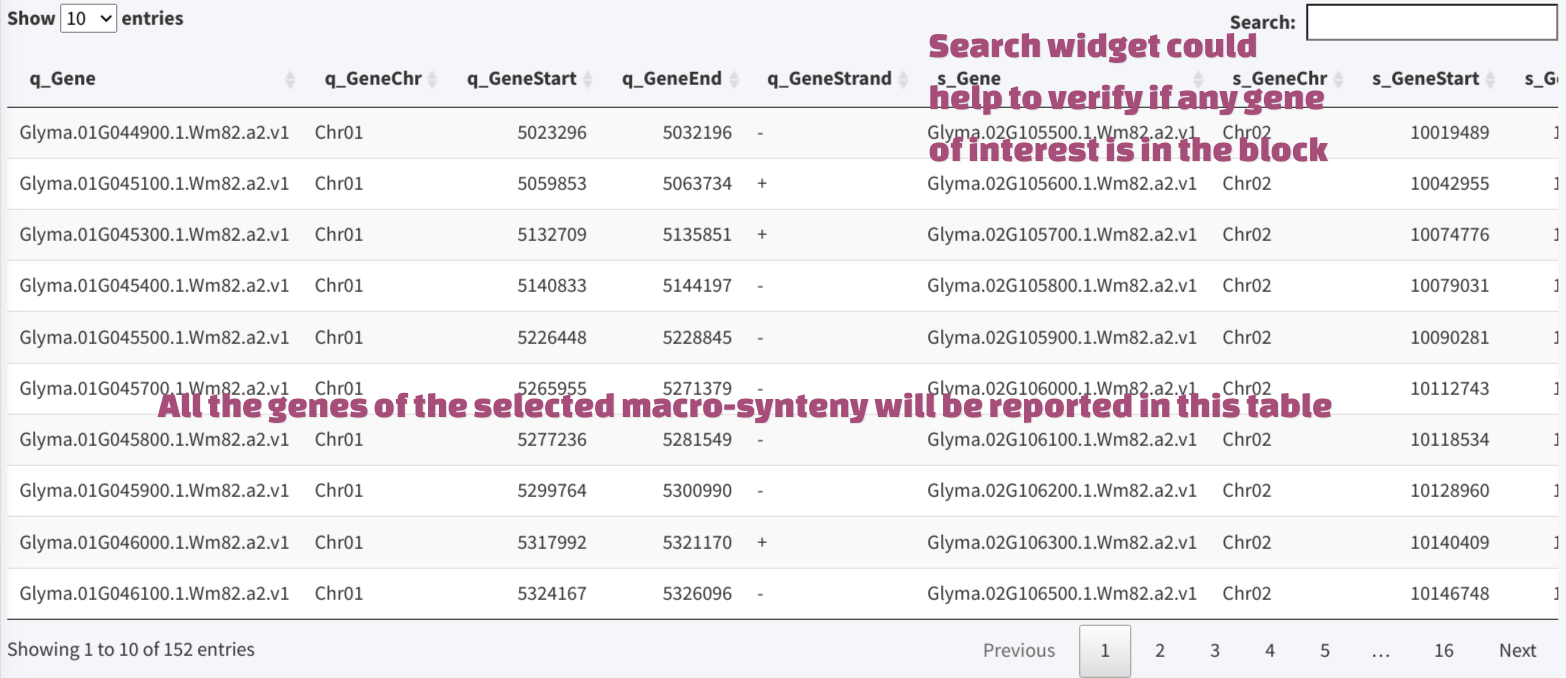
Clicking the ribbon in the macro-synteny view will generate a heatmap of the selected block, the color of the heatmap indicates gene density. A selection rectangle could be used to navigate to specific region within the block, or user could brush on the heatmap to select region. The genes within focused region will be drawn as micro-synteny view below. The genes within the whole marco-synteny block will be reported in a table in the lower panel.
Search genes in micro-synteny
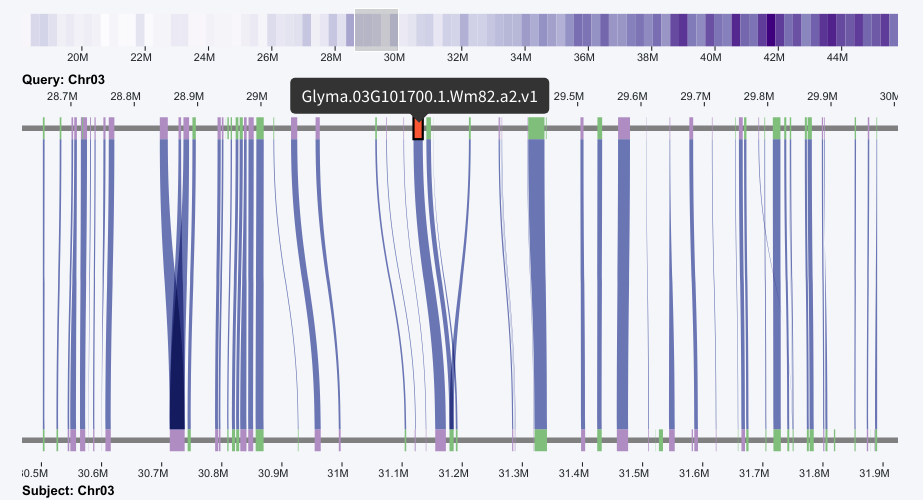
The table has a search widget, which could help users to check if their gene of interest is in the result. After filtering the result, the record could be selected by clicking, then the micro-synteny view will be automatically adjusted to center the region containing the gene, and the gene will be highlighted with the red color.

MCScan commands
python -m jcvi.compara.catalog ortholog $query $subject --cscore=.99 --no_strip_names
python -m jcvi.compara.synteny screen --minspan=30 --simple ${query}.${subject}.anchors ${query}.${subject}.anchors.new
python -m jcvi.compara.synteny mcscan ${query}.bed ${query}.${subject}.lifted.anchors --iter=1 -o ${query}.${subject}.i1.blocks
-
Schmutz, J., Cannon, S., Schlueter, J. et al. Genome sequence of the palaeopolyploid soybean. Nature 463, 178–183 (2010). https://doi.org/10.1038/nature08670 ↩︎