Search Gene of interest
Gene Search
Gene search function was located on Search tab under Tools category.
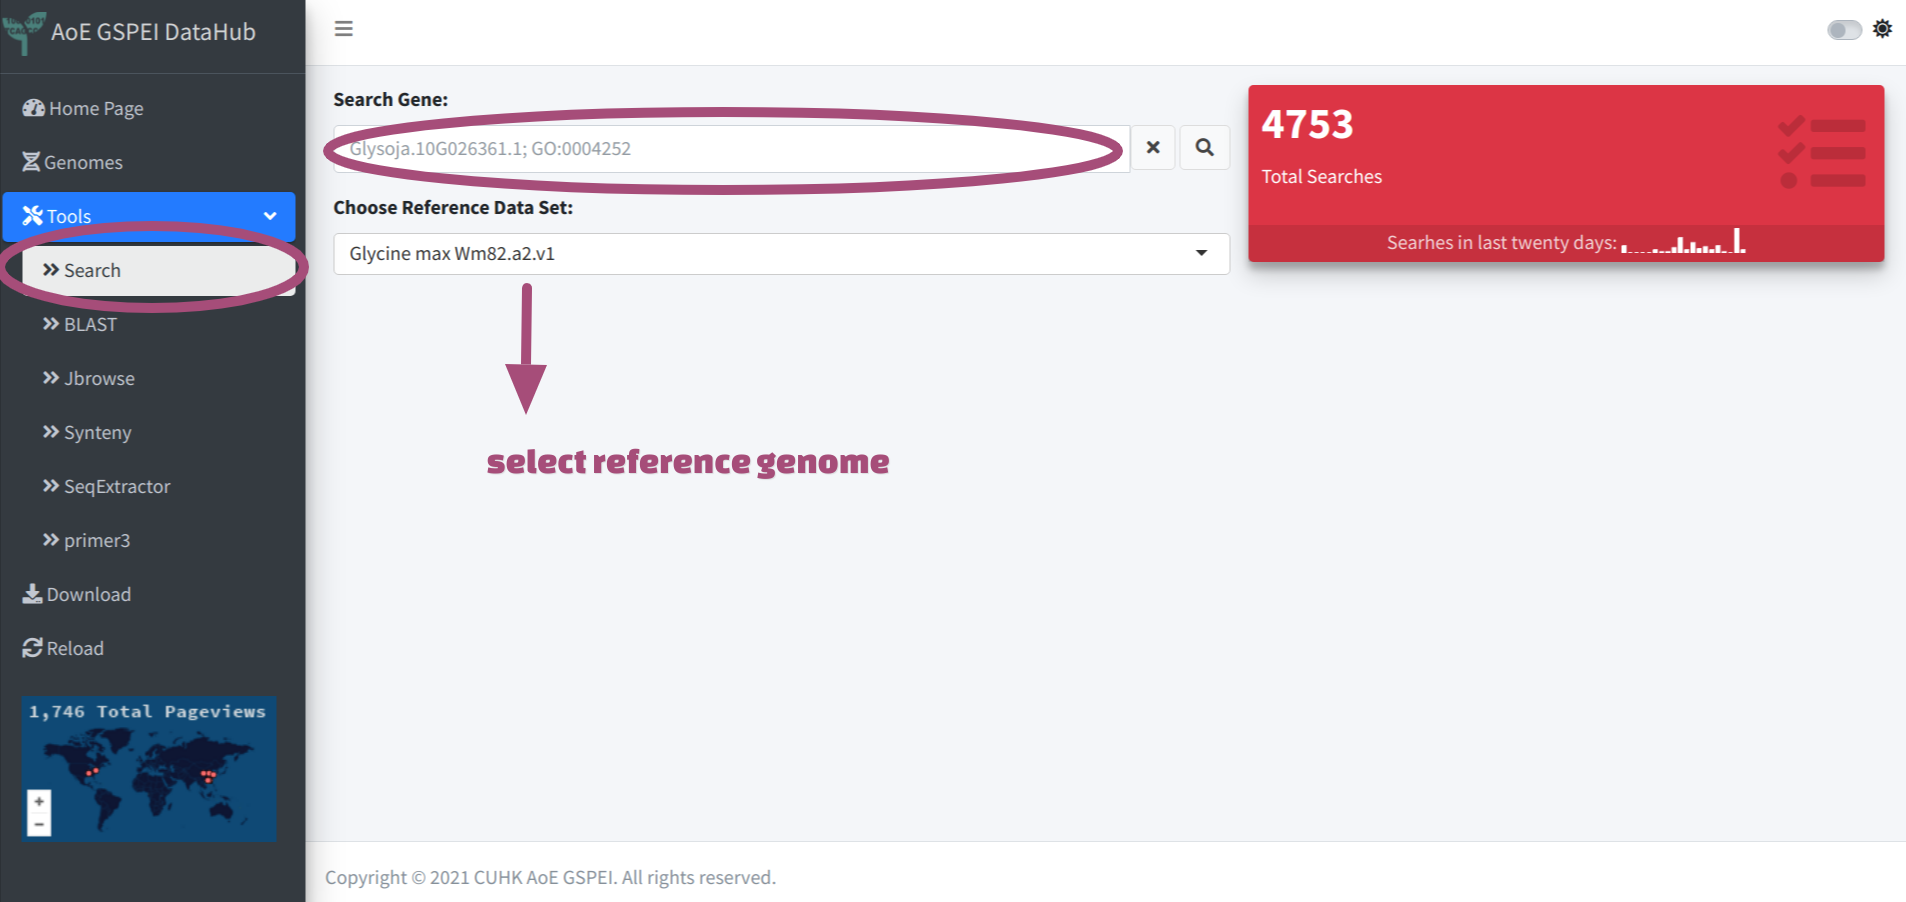
After navigating to the search tab, user could firstly choose target reference genome from the drop-down menu, then input key words and click for searching.
Now the search function only supports intra genome searching, only one reference genome could be selected.
Supported search patterns:
- Gene IDs: Search function support any gene ID from the genomes (e.g.
Glyma.01G200300). - Transcript IDs: Transcripts ID could be used directly for searching (e.g.
Glyma.01G100400.1). - Key word for functions: Users could use function descriptions as key word to get all
the genes annotated with the function of interest. For instance, using
WRKYcould get all transcription factors of WRKY family. - Arabidopsis gene IDs: User could search with the gene ID of interest from Arabidopsis and
get the homologues from targeted soybean genomes (e.g.
AT5G49160). - Genomic Region: In case user is interested in a specific genomic region (e.g. a region identified from
QTL analysis), search function also supports region search and returns all the genes/transcripts
within the region (e.g.
Chr01:33721801-33911600). - InterPro ID: InterPro annotation is quite comprehensive, the result includes varies of results
from different member databases, the full list could be viewed from
InterPro online tutorial,
and all the IDs from member databases are also searchable (e.g.
IPR001750,PF00361). - KEGG Annotation: KEGG K numbers were assigned to all proteins via
KofamScan1. User could search both the K numbers and the
associated Enzyme Commission (EC) numbers (e.g.
K01304,EC:3.4.19.3).
Search Result
The search will return a summary table for all the hits, with genomic coordinates and length of 5' UTR, 3' UTR, and number of exons listed. user could click anyone for detail information.

Function Annotation Information
Basic function annotation were performed by searching the best BLASTP hits against arabidopsis proteome and
UniProt/Swiss-Prot database, with a cut-off as identity >= 30%, coverage >= 80%,
the result will be shown on the left tab, link to jbrowse and external uniprot page will be provided.
Additionally, the proteins were also subjected to a comprehensive InterProScan annotation, and the result
table will be shown on the right tab. The protein domains will be illustrated in the upper panel. Mouseovering
the domain of interest will trigger a tooltip to show details including domain IDs, coordinates on the
protein, and annotation of the function. All InterProScan result will be returned in a searchable table
widgets on the lower panel, including GO terms.

Sequence Tab
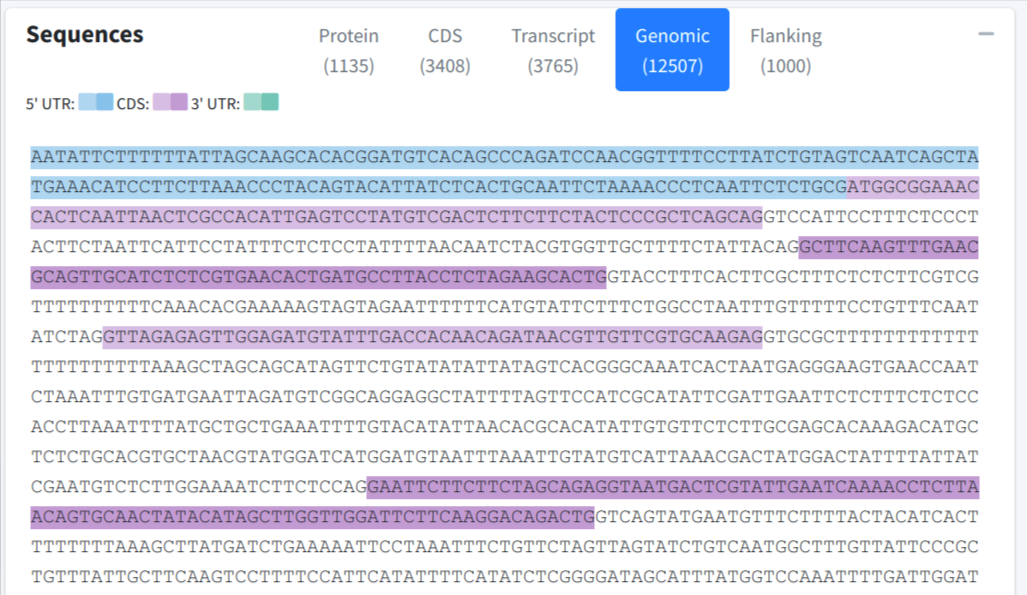
The sequences of the target gene were extracted and returned in a box, which is collapsed by default.
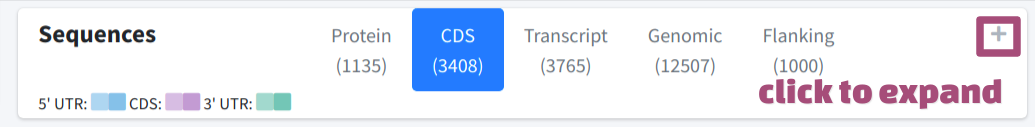
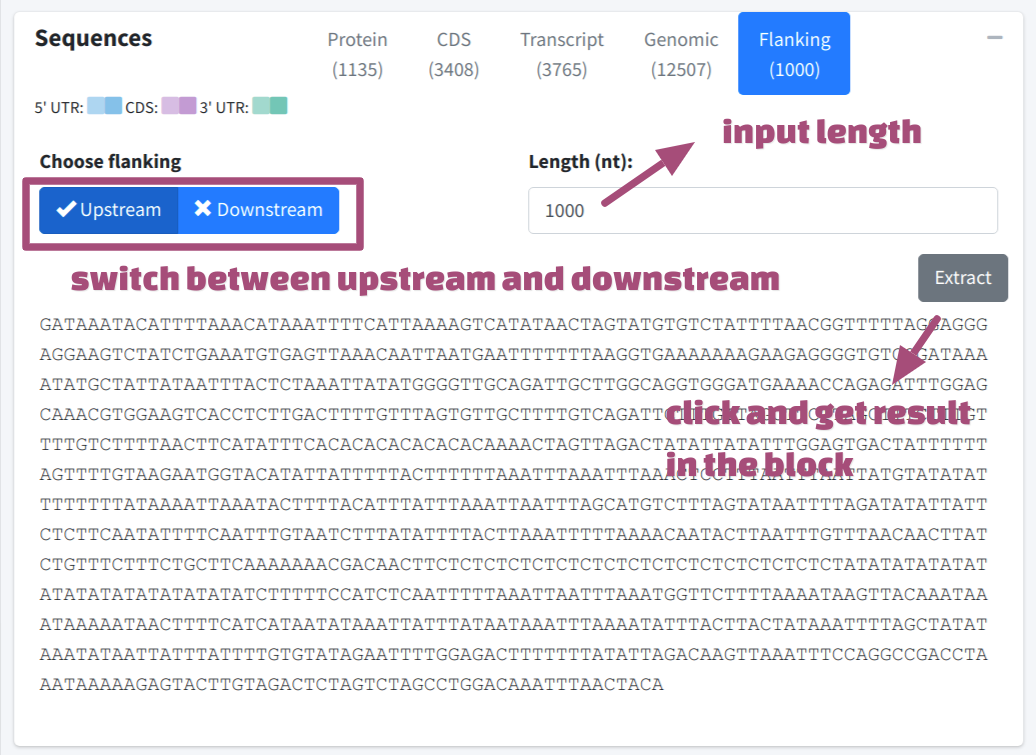
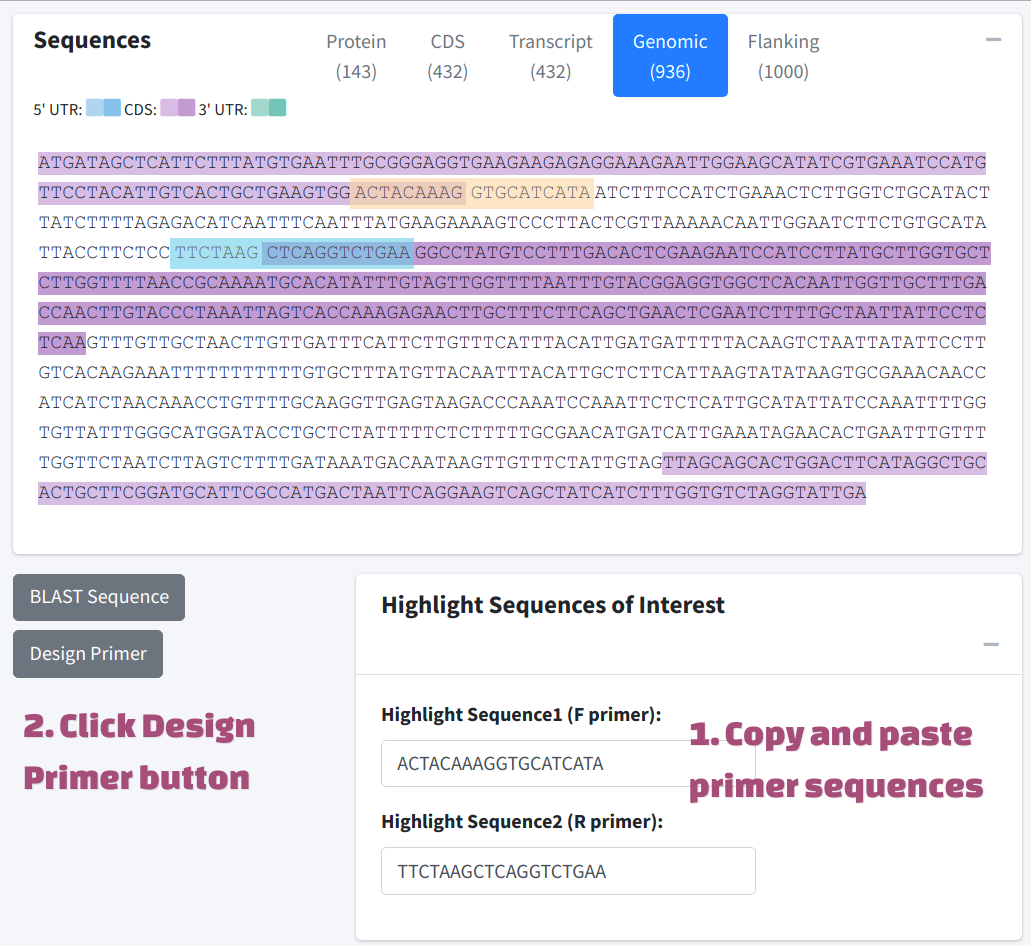
User could switch among different tabs of the box and navigate to specific sequence, including protein sequence, CDS sequence, transcript sequence, genomic sequence or extract flanking sequence on demand. The exons were color shaded with different colors, the adjcent exons were filled with different levels of gradients of the same color: for 5' UTR, for CDS, and for 3' UTR.
Flanking sequences could be extracted by click Extract after selecting target region and inputting required length (nt).
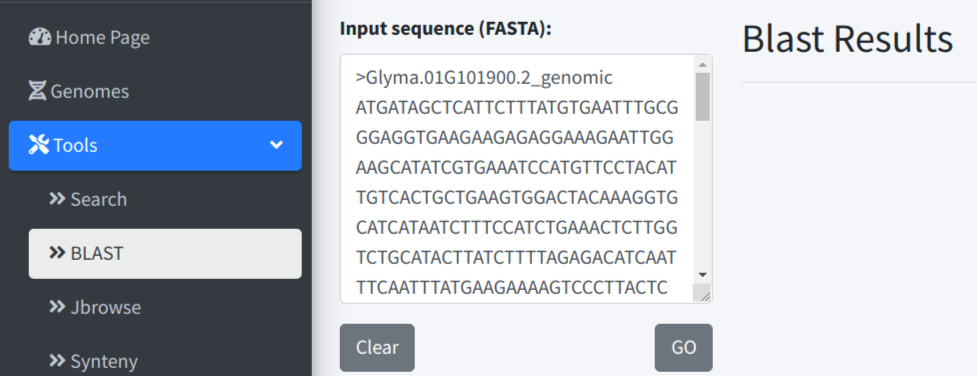
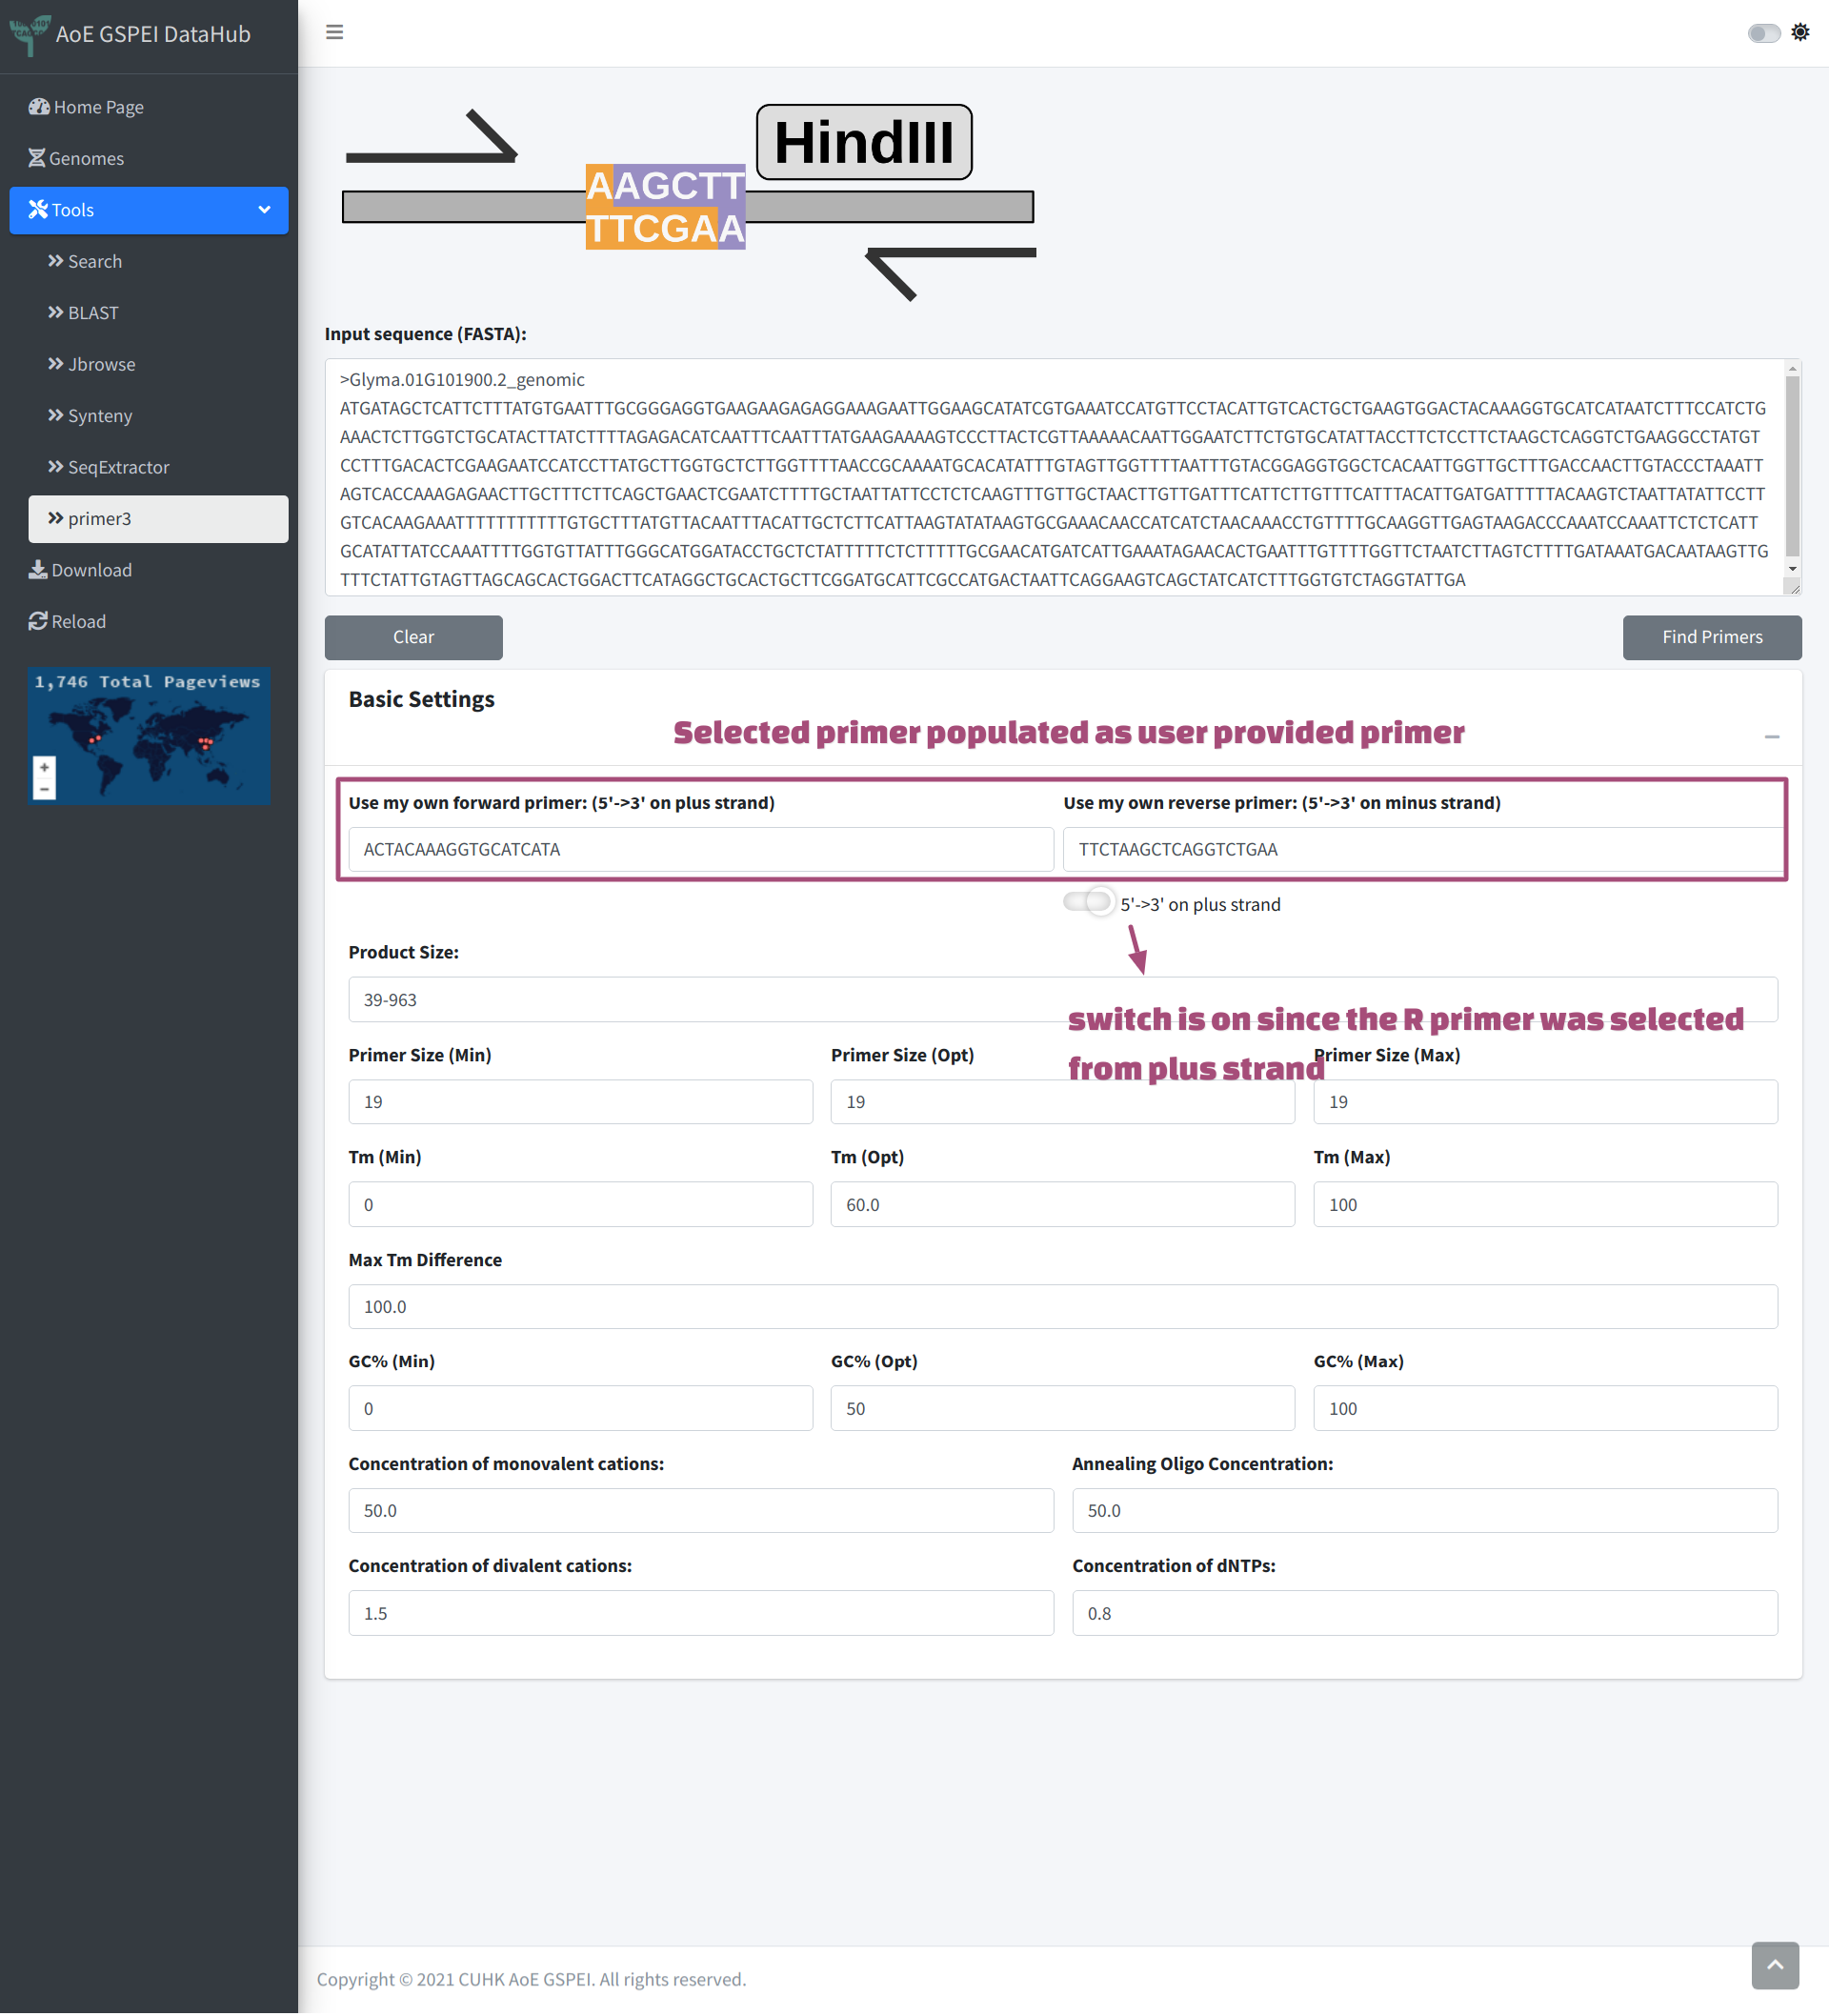
Convenient BLAST and primer design function was provided for users. Click BLAST Sequence or Design Primer button will send the focused sequences (selected tab) to BLAST or Primer3 tab as input.

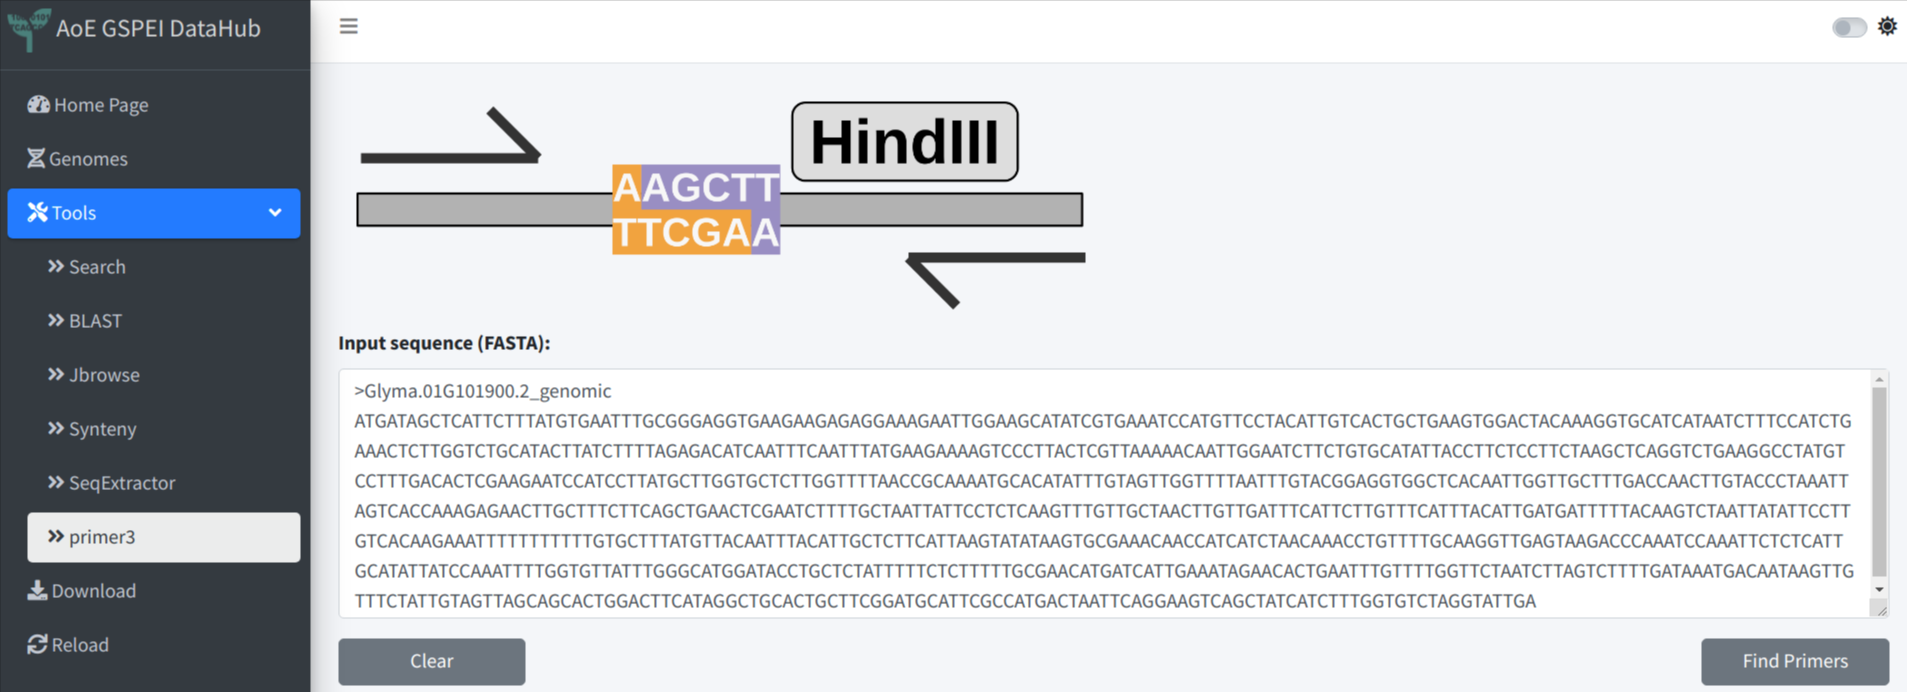
We provide a fast primer selecting box under the sequence tab. This method could help user select primer sequence intuitively and especially easy for junction primer. In the example below, F primer was selected across the boundary of exon 1 and intron 1, R primer was selected across the boundary of intron 1 and the exon 2. After copying and pasting the sequences to the Highlight Sequences of Interest box, the original sequences will be highlighted. Now Clicking Design Primer will also send the selected primer sequences to primer3, which will be used as custom input primer. And the performance of the primer could be obtained by primer3.

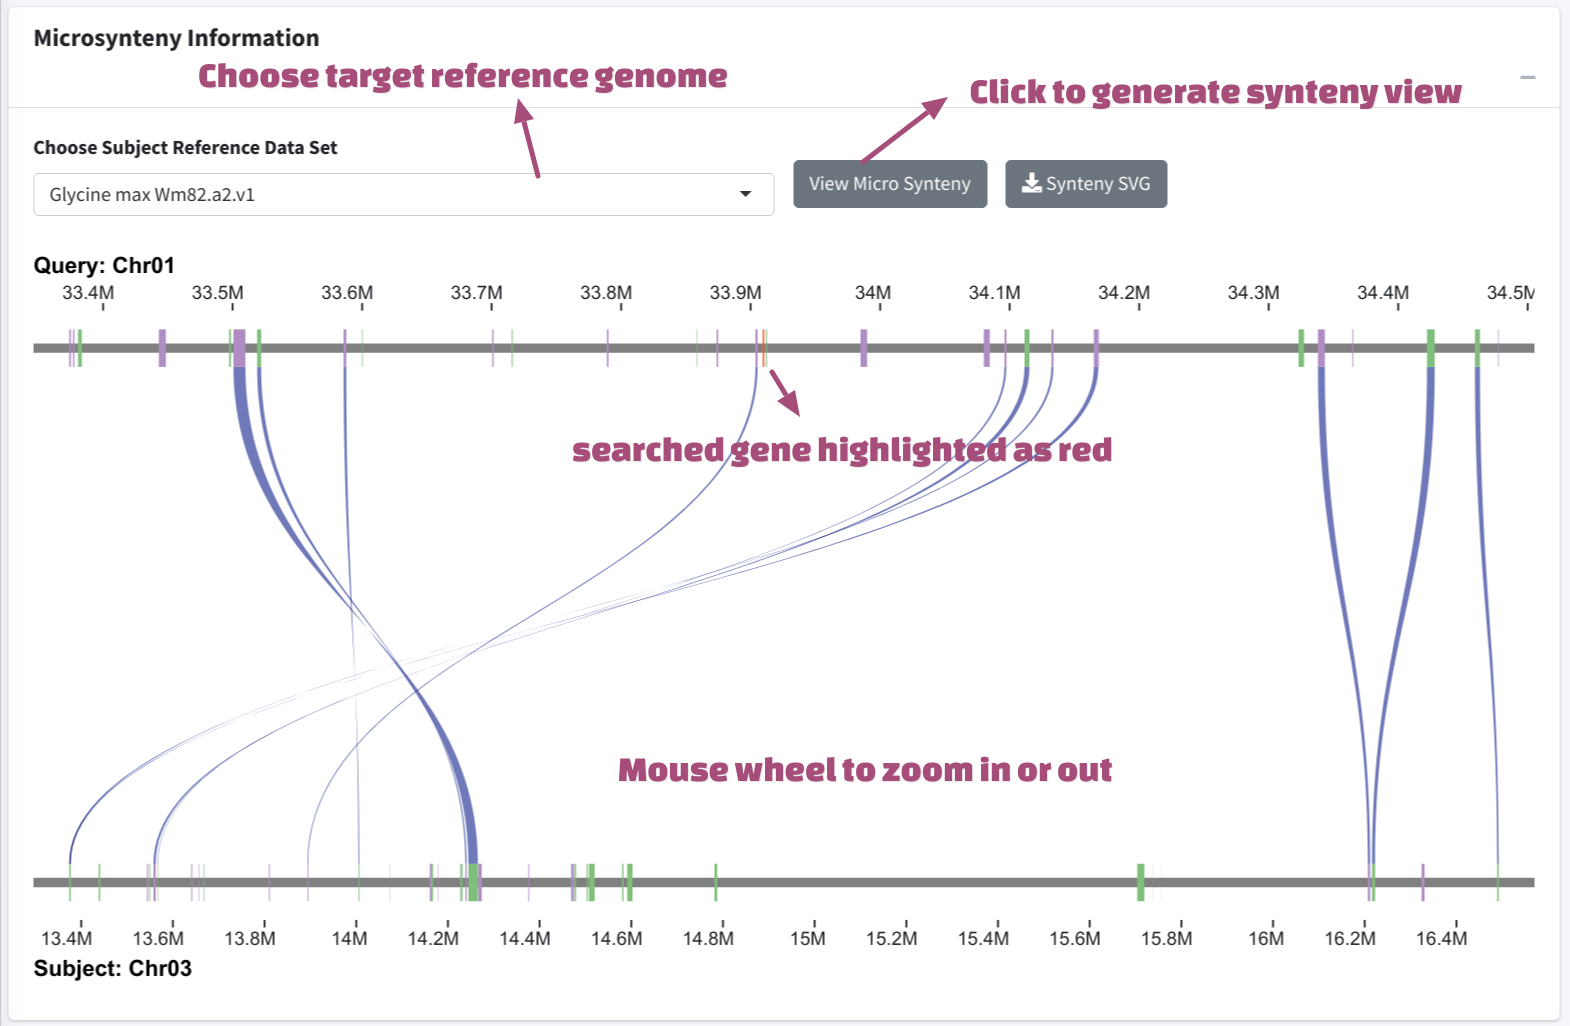
Micro Synteny Information
A micro synteny view could help user to better understand genomic change between the region containing searched genes and homologous region in other genomes, as well as the homologue gene(s) of the searched gene. Thus we provided synteny view under each gene search, a demo is illustrated below, detail will be covered in the synteny tab section.
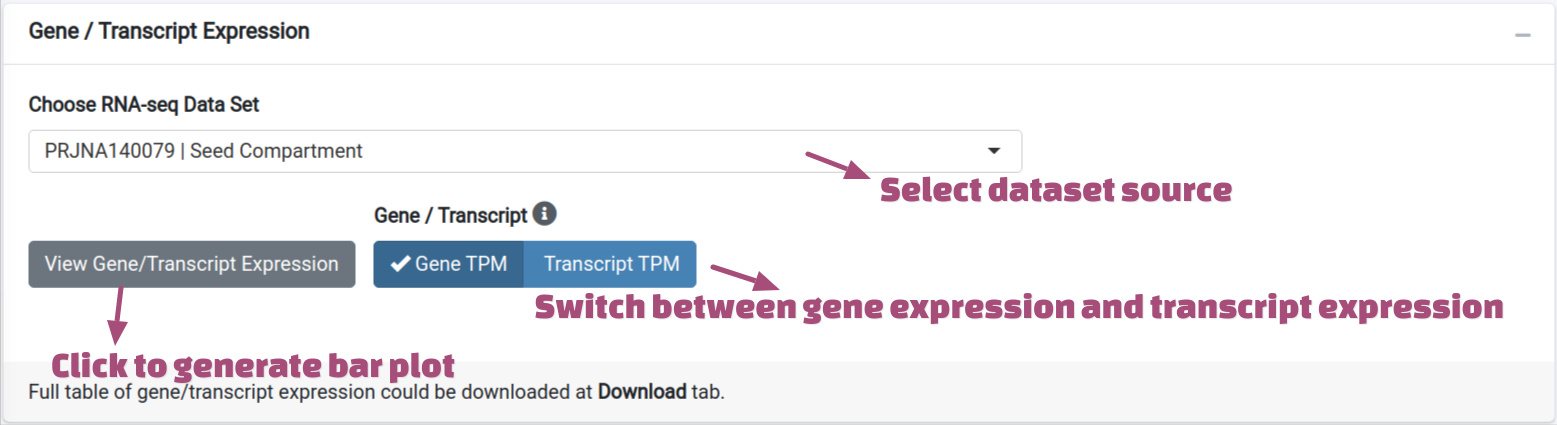
Gene or Transcript Expression
User could view the expression value as bar plot after searching. The TPM values
from varies of datasets were pre-calculated and could be selected from the drop down menu. Users
could choose to view the TPMs on gene level or transcript level, and click the
View Gene/Transcript Expression button to generate the plot.

There is a tools bar on the top right corner of the plot. The plot could be zoomed in or out
by and button, or
select a specific region after clicking Zoom button. The plot could then be reset by
clicking button. User could also save the plot to their own
computer via clicking button
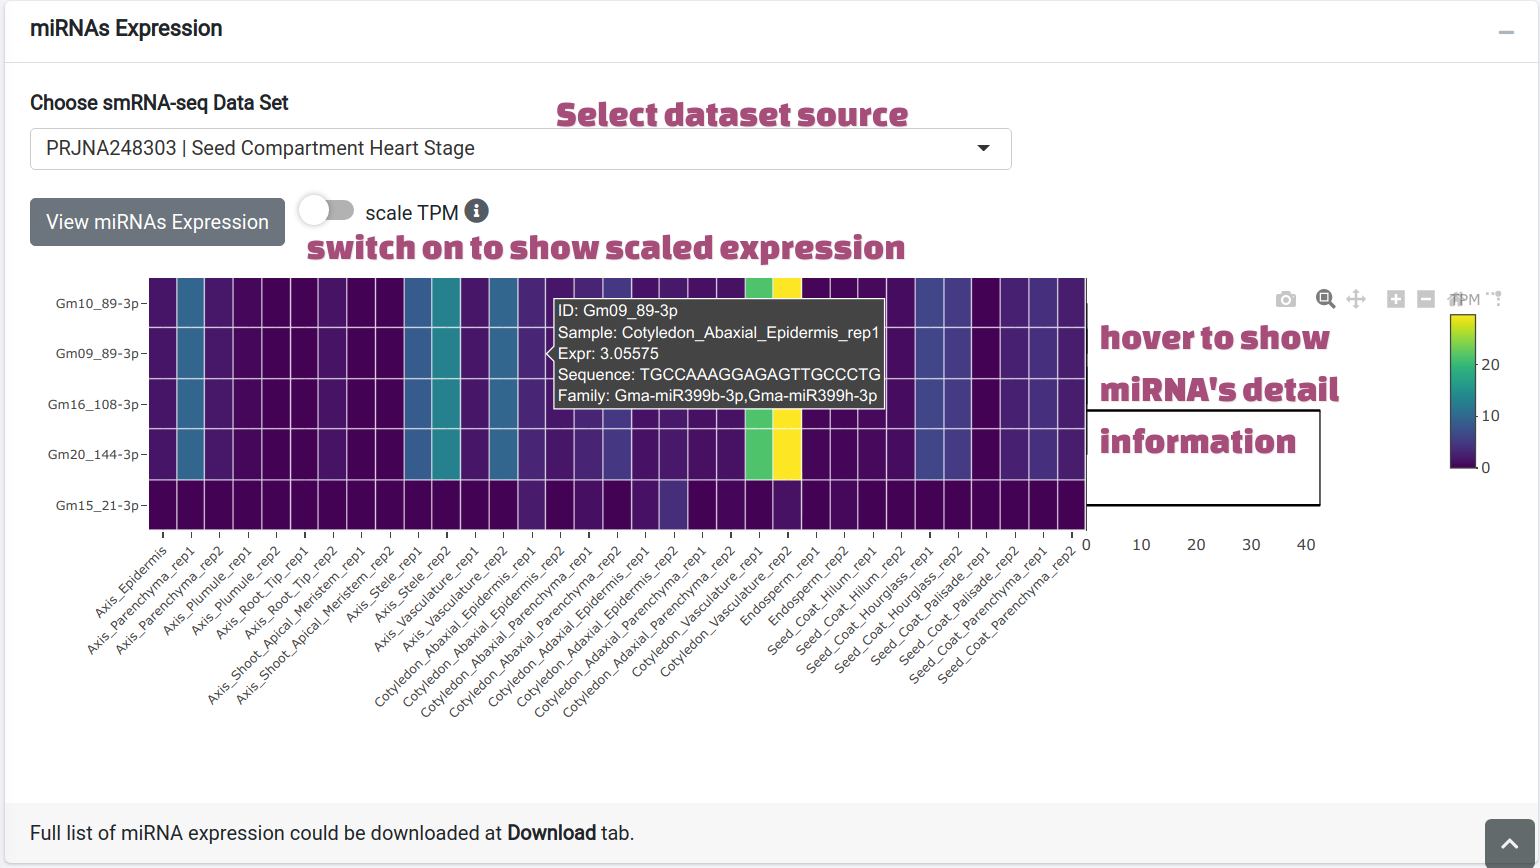
miRNA Targeting and Expression
We also integrated smRNA seq datasets to infer the relationship between genes and
the miRNAs. The smRNA data were analyzed by mirDeep-P2 pipepline and
psRNATarget web service was used to predict
miRNA targets. After clicking View miRNAs Expression button, the miRNAs targeting
searched transcripts will be shown as a heatmap with a tooltip indicating their family
and mature sequences.
-
Takuya Aramaki, Romain Blanc-Mathieu, Hisashi Endo, Koichi Ohkubo, Minoru Kanehisa, Susumu Goto, Hiroyuki Ogata, KofamKOALA: KEGG Ortholog assignment based on profile HMM and adaptive score threshold, Bioinformatics, Volume 36, Issue 7, 1 April 2020, Pages 2251–2252, https://doi.org/10.1093/bioinformatics/btz859 ↩︎